The world’s oldest countries – and what they mean for marketers
According to the UN, the number of over-65s is forecast to double by 2050. Some countries have older populations than others – what does this mean for international marketers?

Considering international expansion to new countries via PPC or reviewing your current per-market budgets for paid media? Mostly (for new countries) you’ll be looking at macro factors like market size, internet penetration, competition. For current markets, you’ll have historic data points from your PPC campaigns to review and compare. But an often-overlooked factor is the importance of online connection speeds to the planning, execution and optimisation of your PPC campaigns.
Although the broad issue is around delivering a great user experience via PPC – slow website load times are super frustrating after all – the specifics relate to good old QS, and the impact of QS on your campaign costs via the Ad Rank calculation, and thus on overall PPC efficiency. Let’s explain.
Quick reminder – your Quality Score depends on multiple factors, including:
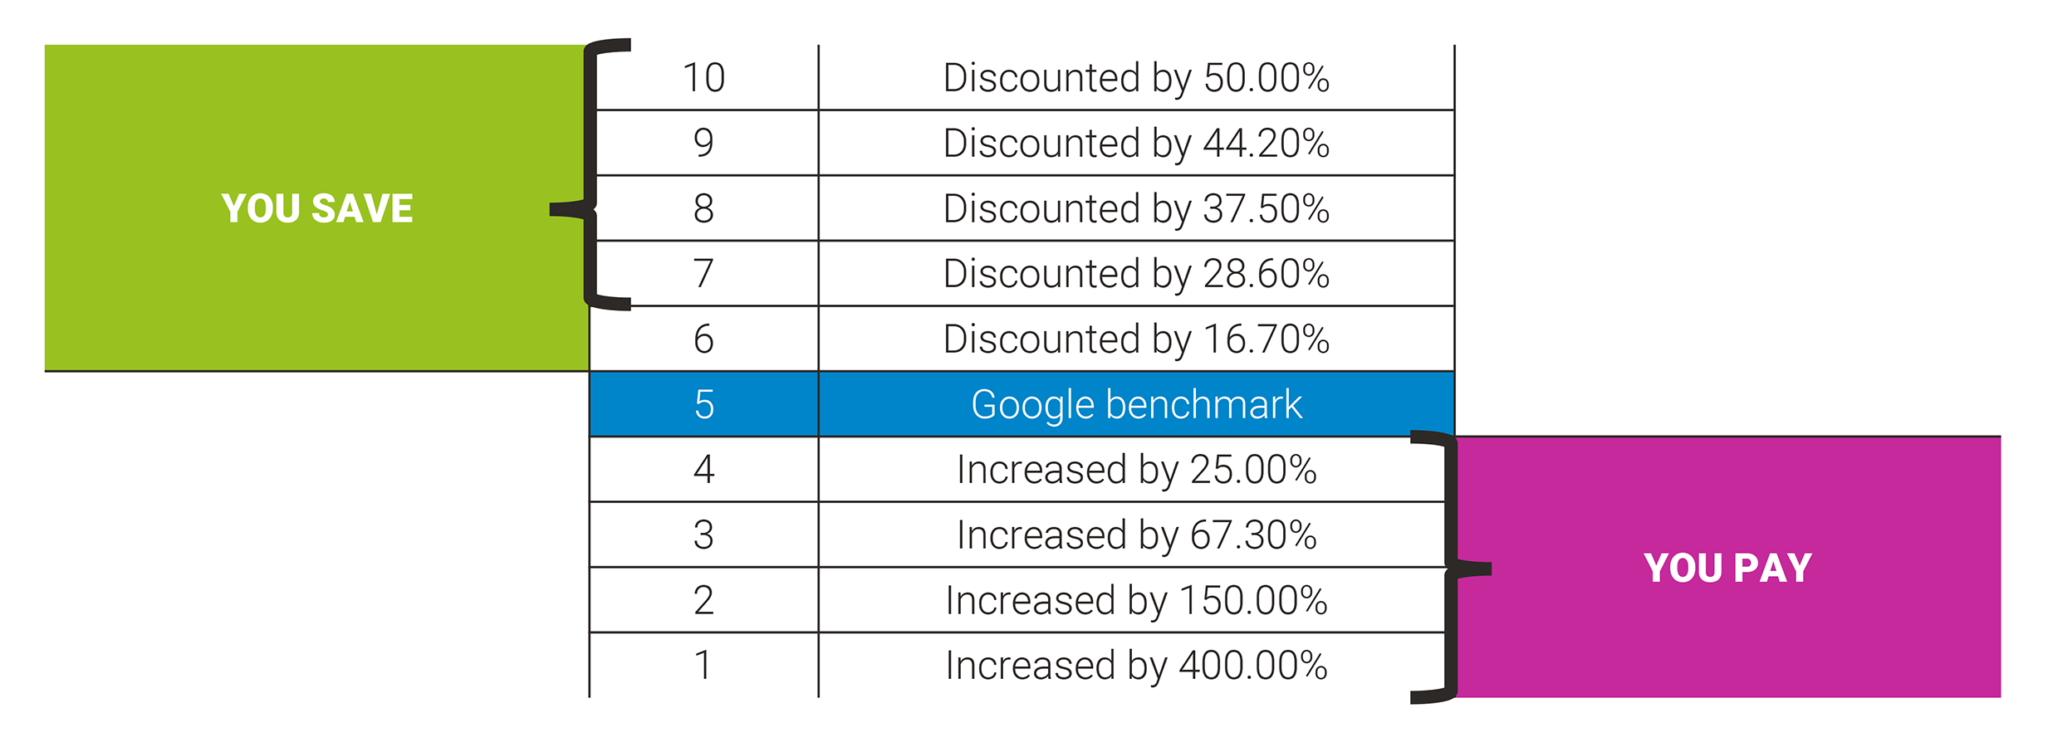
No one outside of Google knows exactly how much each factor “weighs” in the Quality Score algorithm, but we do know that click-through rate is the most important component. When more people who see your ad click it, that’s a strong indication to Google that your ads are relevant and helpful to users. Accordingly, Google rewards you with:
Sounds good! And what about the impact of quality score?
 (Source: Wordstream)
OK, so better QS can reduce CPC…but where does website and page load speed fit in? Let’s take a look at what Google themselves say about this:
“If it takes too long for your website to load when someone clicks on your ad, they’re more likely to give up and leave your website. This unwelcome behaviour can signal to Google that your landing page experience is poor, which could negatively impact your Ad Rank. That’s why you want to make sure your landing page load time is up to speed” (Source: Google)
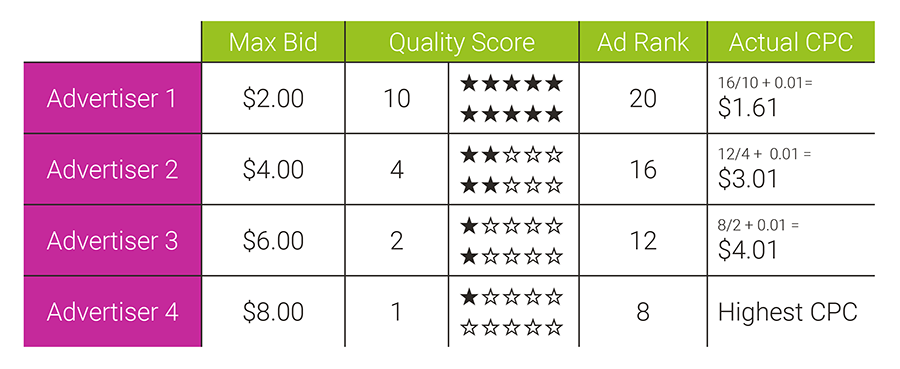
Don’t forget that negative impact on Ad Rank can create significant campaign inefficiencies, specifically in relation to CPCs; see below:
 (Source: Search Engine Land)
In the example above, we can see that although Advertiser I’s maximum bid is significantly lower that Advertiser IV’s, Ad Rank is much better and hence CPC is most efficient for Advertiser I.
So, two things to consider:
#1 It is logical to assume (via Google’s statement) that page speed is being factored into Ad Rank, and thus that advertiser I’s efficiency (lower CPCs) is likely being helped by better performing (faster) landing pages.
#2 It is also clear that page load speed is factored into ‘landing page experience’
…and in turn affects quality score, again, with impact on Ad Rank and CPC.
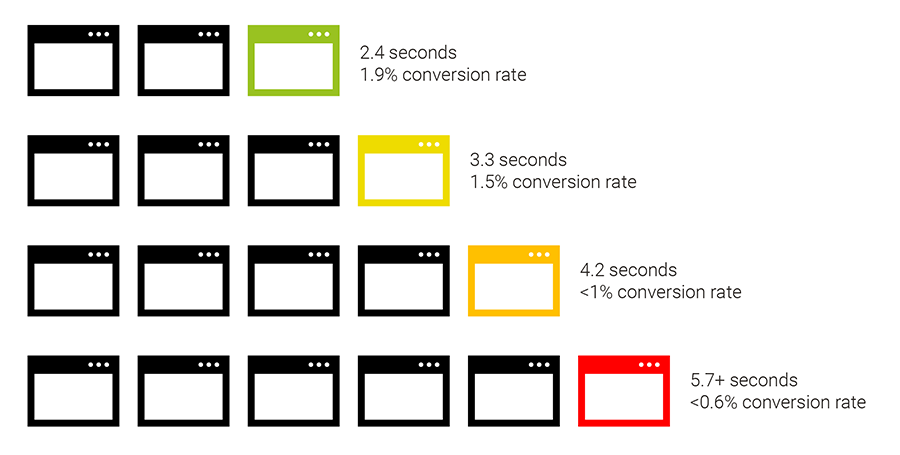
In addition, slow load times will significantly degrade your conversion rates (CVR):
(Source: Cloudflare)
Here’s a likely scenario. Using PPC, you are planning to push into a new market, or expand activity. And part of your planning process is to forecast results and compare across markets to clarify the best destination for your PPC budget. The summary above on the importance of page load speeds should convince you to factor this into your decision making. So, where to start? How about initially in Europe, looking at average site speeds per country:
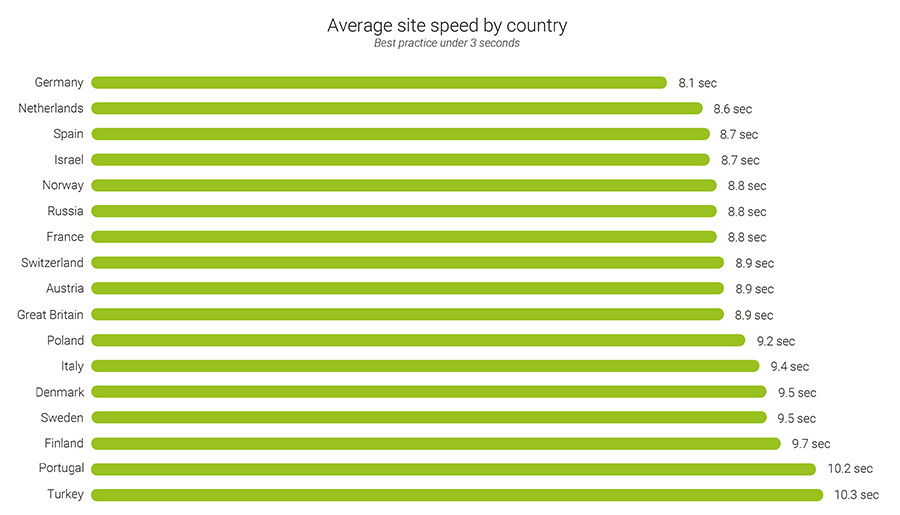
(Source: Think with Google)
Interesting of course that the average loading time is currently 9.1s —more than 6 seconds slower than the best practice of three seconds. Retail sites were the slowest performers—chugging in at 10.3s.
But not as helpful (because sites can be improved – see below) as data which clarifies connection speeds: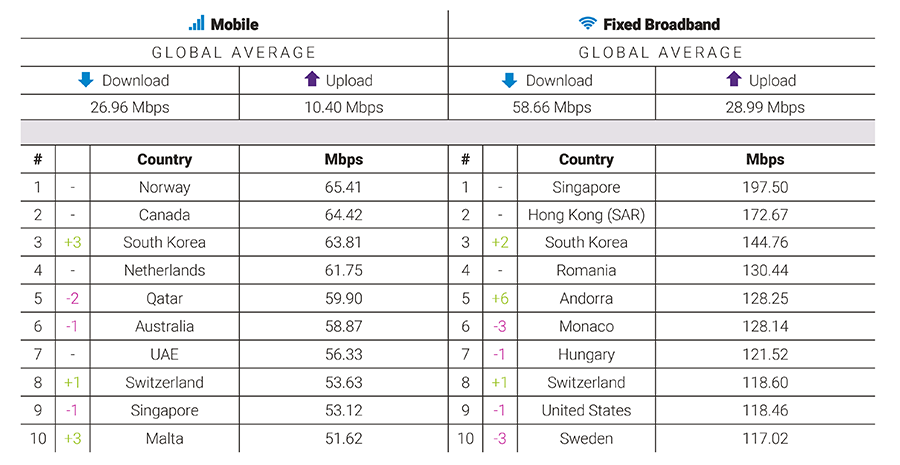 (Source: Speedtest)
This data set is most useful because it clarifies how the ‘speed’ of the same landing page (yours?) is likely to perform across different markets. Good to know!
How does this look if we create a simple model?
Let’s assume that:
NB 10% is an educated guess but is a good start point given Google’s emphasis on the importance of page load speeds, especially for mobile devices. (For example, see https://developers.google.com/web/fundamentals/performance/why-performance-matters/). Also likely to be significantly factored in as it is easily measurable, and easier to measure than landing page quality/relevance.
The table below illustrates that although Advertiser A has the best Ad Rank due to highest QS, advertisers B and C can achieve identical Ad Rank with varying combinations of CPC and QS:
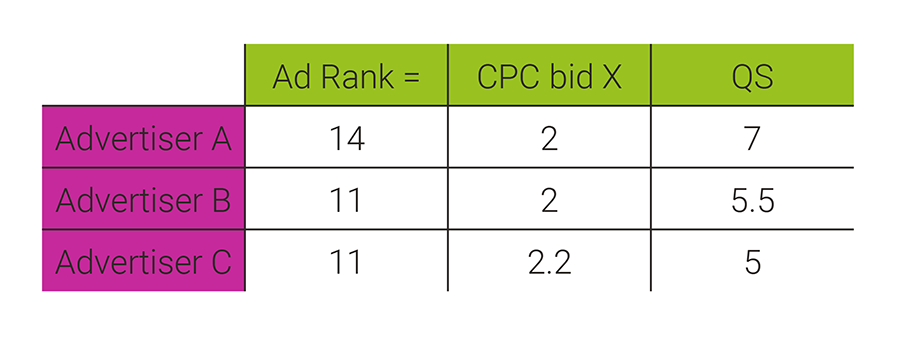
Specifically, advertiser C can save 0.2 per click due to a 10% improvement in QS. This is assumption based, but even if we reduce the QS improvement to 2.5% if spending £250,000 annually on international PPC media, 2.5% is a saving of £6,250. Not to be ignored. And at a ROAS of say 5, it delivers £31,250 in extra sales – definitely not to be ignored!
So across which markets can, we see this difference in mobile download speeds? How about in the Gulf:
Or in Eastern Europe:
Or North American markets:
And on desktop we can see significant differences within EU markets:
NB desktop clicks are more expensive than mobile, so it will pay to keep an eye on your mobile vs desktop approach and plan activity and budgets accordingly.
First, if you already have relevant in-market data from current campaigns, you can compare market A to market B, and review page load speed data via Google Analytics:
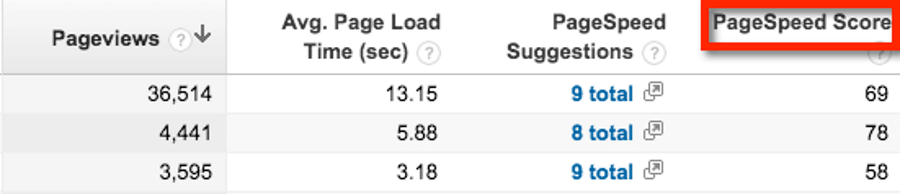
Also, check QS within the AdWords account and build out an evaluation framework to support your decisions. Then, create an action/test plan to address the page speed suggestions and see how improvements impact score and (if possible) CPCs.
If you are new to a market but have data from a market with similar connection speeds, compare with markets where connection speed is superior and forecast accordingly, factoring in a range of possible speed impacts on likely CPCs and CVR.
Of course, this mix of page speed, load time and connection speed is only one factor to consider when planning your international PPC activity. But, it is possible to analyse trends, select favourable markets, culturalise (of course) your landing pages to in market needs, and optimise accordingly.